How to forecast retail sales
For a recent project, I collaborated with a team of fellow students in attempt to forecast two weeks of retail sales for a large grocery chain. The retailer locations included five different locations across California, and the products considered were anonymized items from 5 different retail categories. This forecasting used a combination of calendar events and past daily sales for these stores. The main questions we had during this project were as follows:


1. What types of time series models perform best in this context?
2. Are these "best" performing models feasible to use at scale?
To determine the "best" model, we used a combination of MASE (mean absolute scaled error) on the forecasted sales figures and Ljung-Box test to assess the normality of the residuals on past values. Essentially our goal was to have our forecasted predictions as close as possible to the true future sales figures and the difference between our model's fit on previous sales values and the true sales values to be normally distributed across the entire timeframe considered. Our analysis considered roughly 5 years of daily sales to forecast 14 future days.
Predictions from a Prophet time series model for one item's sales over the timeframe can be seen below:

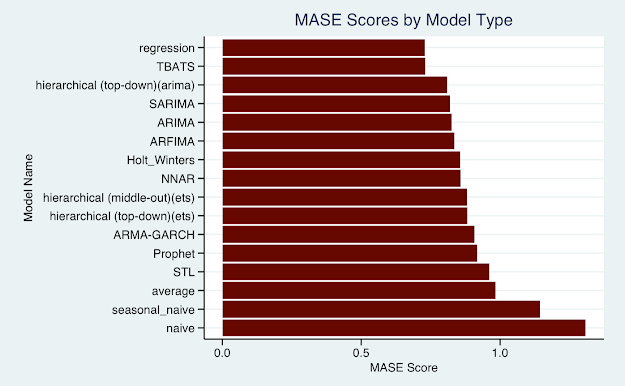
Overall, 16 different model types were considered, fit, and scored on the metrics outlined above. For the 16 different models, the average of the MASE scores across all items can be seen below:

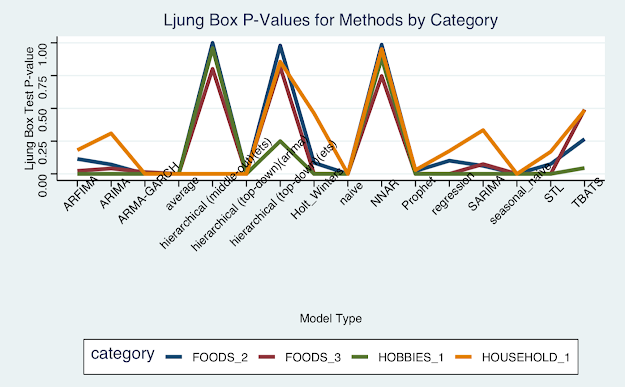
Interestingly enough, a linear regression performed best (lower MASE score means more accurate predictions) in terms of MASE score on forecasted values beating out much more sophisticated models like a deep Neural Network (NNAR) and hierarchical ARIMA models. Perhaps less surprisingly, the naive method, which assumes all future values will be the same as the most recent recorded value, performed the worst overall. The second metric considered in ascertaining the "best" model can be seen here:

For this metric, bigger is better with anything above .05 being considered not statistically significantly different from a normal distribution. Clearly the top models, Neural Network, Hierarchical Model, and TBATS have successfully "whitened" the residuals on past values. With both metrics calculated, we can combine into a composite score for each model's overall performance:

This quantitative methodology would nominate the deep neural network model as contender for "best" overall. However, that model was only feasible because this experiment limited the scope of analysis to five retail stores and only a handful of items. A typical grocery retail store will stock thousands of items at all times, so this method quickly becomes computationally infeasible. Fitting thousands of parameters to thousands of items across hundreds of stores simply is not worth the cost of time and computation.
That being said, a more elegant solution would be a top-down hierarchical model. This model relies on a product's past proportion of a category, and that categories' proportion of a whole as sales fluctuate over time. Since this model considers performance at a macro scale and then drills down into individual items, it is much more computationally efficient than fitting neural networks onto each individual item. The slight dip in overall performance calculated above is certainly worth the feasibility to scale this model beyond a limited training dataset.
For good measure, below are a couple more pretty visuals I created with this data. This is the same information outlines above, but before scores were aggregated across different product categories. No new information can truly be gleamed besides enjoying some additional color. Thanks for reading.


Comments
Post a Comment