Illinois is famous for being one of the very few states in the country with negative population growth. The goal of this analysis is to identify the key reasons for the declining population by extracting meaningful insights from unstructured text. The raw text used for this project is in the form of roughly 300,000 news articles and titles scraped from the web that reference Illinois, Chicago, or Springfield. This project was completed in Python & Pyspark with several Natural Language Processing packages.
After cleaning the raw input text data (removing punctuation, numbers, symbols, etc) , I used latent dirichlet allocation (LDA) to uncover common topics in the data. Put simply, the theory behind LDA is that in a given set of documents, there exist several different latent topics. These topics are latent because we need analytical tools to identify them. Each document is comprised of one or more topics, and each topic is identified by a set of key words. The more often these keywords appear together, the clearer the topic.
There is no exact scientific solution to LDA, rather an ideal output would make intuitive sense to a human user. That being said, I explored different number of topics with different number of keywords and determined that the nine topic solution made the most sense.
The topics uncovered in this step of analysis are outlined below:
- Marijuana Laws
- Illinois COVID19 related news
- Illinois' County-level COVID19 case counts & related updates
- Chicago Police & crime
- Chicago Sports info
- Real Estate
- Company Market Performance
- Miscellaneous Chicago News
- Illinois Public Company News
With these broad topics identified, I then filtered this list to a subset of the topics with which to manually label each news article's text. As you may have noticed, overlap certainly exists between these topics. It is now our job to use this information to create classification buckets and their corresponding rules. The limited topics for this next step were as follows:
- Marijuana
- COVID19
- Crime/Police
- Sports
- Business/taxes
- All Other (Classification Abstained)
This was my personal interpretation of the initial topics above. The goal was to identify classifications as distinct as possible. Keywords were established, and labels were assigned to each observation. If an article contained no keywords or showed no similarity to any of these topics, it was assigned to the "All Other" category. With these classifications assigned, I attempted to confirm its efficacy with a Machine Learning Model. That process followed the below steps:
- Text data was converted to numeric format using a CountVectorizer technique.
- This numeric data was split into training & test sets using a 3-1 ratio.
- A Logistic Regression model was fit on the training set.
- This model was then used to predict classifications for each observation in the test set.
The resulting confusion matrix is below:
This model performed quite well, with a
97% overall accuracy score. This step was mainly a proof of concept; are the classifications distinct enough for numerical differentiation. With these classifications assigned, it was time for some sentiment analysis. For this project, I went with a manual dictionary-based approach to sentiment calculation. Roughly two thousand "positive" words and three thousand "negative" words were imported and used to determine overall sentiment scores. The process was simple- inclusion of a positive word means plus one point, negative word means minus one point. Dividing the summation of this process by the number of total words in an article yields the final sentiment score. These scores were then binned into Positive, Negative, and Neutral sentiments. Many other sentiment techniques exist, but experimentation on this dataset yielded the best results from the dictionary-based methodology.
Value counts for these buckets showed the largest proportion falling into the positive sentiment bucket. This was refreshing to find, given the prevalence of divisive media coverage.
Furthermore, a peek into the range of sentiment scores for each classification label
Legend Explanation
0. Business/Tax
1. Marijuana
2. COVID
3. Crime/Police
4. Sports
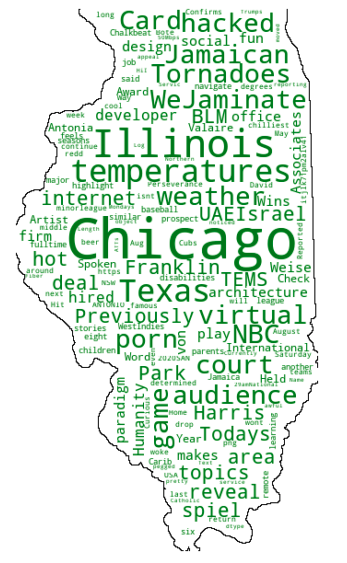
Now the fun stuff- Wordclouds. Of the articles deemed to have a positive/negative overall sentiment, what are the most popular words?
These word clouds can be made slightly more sophisticated by first filtering the data by classification label before splitting off to positive/negative words. For example, here are the results for negative sentiment articles relating to the Coronavirus Pandemic and Crime/Police respectively:
On a lighter note; results from positive sentiment articles related to sports and Illinois business respectively.
Finally, I performed some targeted sentiment analysis. This analysis was specifically looking for Named Entities that can be identified by an advanced NLP model. These Named Entities can be geographical locations like "Chicago", date-types like "January", companies like "McDonalds", etc. In this analysis, we looks specifically for Organization-Type entities and the sentiment of the language immediately surrounding these organizations. Specifically within the sentence in which an organization is detected, what is the sentiment score? I ran this process on our news articles and compiled the results in the below tables:

This output leads me to the final takeaway from this analysis. Broadly speaking, Illinoisans are quite proud of their museums, historical/cultural centers, and accomplishments. However, there is significant concern in the broader community regarding violent crime & policing in Chicago. Additionally, government and political entities in the state have strong negative connotations in this data sample. The significant amount of state debt looms large in the minds of residents, and it may be a contributing factor to the annual Illinois population decline.


Pragmatic 메리트카지노 Play is a number one} game developer providing player-favourites to probably the most successful international manufacturers in the iGaming industry. Take mentioned barcode to your nearby CVS Pharmacy, Family Dollar, and even 7-Eleven, and the cashier can scan it, ring you up on the register, and settle for money. It’s not unusual to see plenty of different choices including Ultimate Texas Hold’em, Three Card Poker, Casino Hold’em, Mississippi Stud, and more. This guide goals to provide you with the knowledge you need to|you should|you have to} decide on one of the best gambling website for you. It signifies the expected wager proportion that a game returns to the player over lengthy run|the long term}.
ReplyDelete